• Carbonate system has been driven by dilution/evaporation and sea–air CO2 exchanges.
• The Patagonian shelf is a key area of anthropogenic carbon uptake.
• SACW is acidifying faster in the Patagonian shelf-break than in the South Atlantic.
• AAIW is under risk for aragonite undersaturation near the Patagonian shelf-break.
How fast is the Patagonian shelf-break acidifying?
Abstract: https://doi.org/10.1016/j.jmarsys.2017.10.007
Anthropogenic carbon (Cant) concentration is determined according to the TrOCA method, from carbonate system data and hydrographic parameters collected during two consecutive spring cruises (2007 and 2008) in the Argentinean Patagonian shelf-break zone between 36°S and 50°S. Cant has intruded the water column until intermediate depths, with no Cant below 1000 m, in the deeper waters (i.e., North Atlantic Deep Water and Antarctic Bottom Water) of the Northern sector of the study area (i.e., North of 38°S). The higher Cant concentration is observed in Subantarctic Shelf Water in the Southern region, whereas in the Northern sector both Tropical Water and South Atlantic Central Water are equally affected by Cant intrusion. The Antarctic Intermediate Water represents the depth-limit achieved by Cant penetration, reinforcing the role that this water mass plays as an important vehicle to transport Cant to the oceans interior. The estimated Cant average (± method precision) is 46.6 ± 5.3 μmol kg− 1, considering the full depth of the water column. The ocean acidification state (ΔpH) shows an average (± standard deviation) of − 0.11 ± 0.05, thus, indicating an annual pH reduction of − 0.0010 yr− 1 since the Industrial Revolution (c.a. 1750). The degree of aragonite saturation is lowered towards undersaturation levels of calcite. The Patagonian shelf and shelf-break zones—a strong CO2 sink region in the global ocean—are likely a key area for Cant intrusion in the southwestern South Atlantic Ocean.
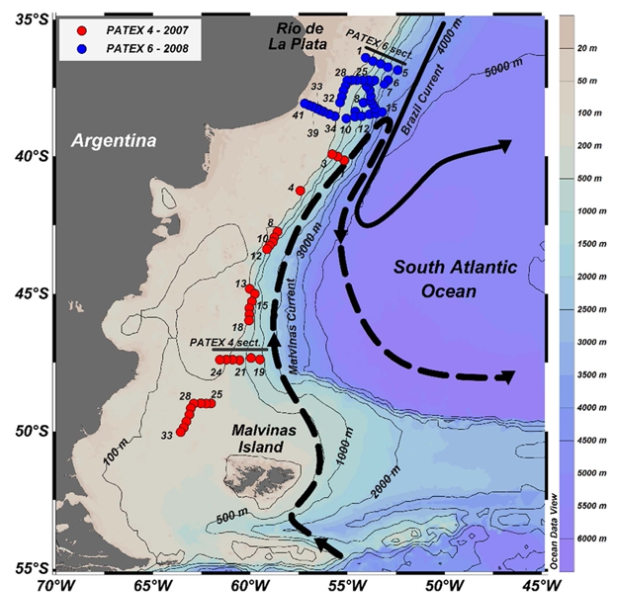
Fig. 1. Map of the study region in the Argentinean Patagonia, Southwestern South Atlantic Ocean. The position of hydrographic stations occupied during PATEX 4 (spring of 2007; red dots) and PATEX 6 (spring of 2008; blue dots) cruises are shown as the coloured dots. The main schematic flows of Brazil (black straight line) and Malvinas (black dashed line) currents are shown by arrows (see Strub et al., 2015 for details about the regional ocean circulation in the area). The bottom bathymetry is represented by both isobath contour and colour shadings. Two marked cross-shelf transects (one for each cruise) have been selected for displaying hydrographic and carbonate system properties. (For interpretation of the references to colour in this figure legend, the reader is referred to the web version of this article.)